Perhaps because I didn't grow up in the U.S., and definitely because I am interested in television and advertising, I am absolutely fascinated by the Super Bowl.
It's a major sporting and cultural event in this country, complete with the urban legend, social elements (plans almost take on the importance of NYE in some circles), and consumerism that marks any holiday.
Consumer culture is alive and well in the Super Bowl. Americans spent an estimated $9.5 billion on related expenses this year, acquiring about 2.4 million HDTVs, according to a report in Cynopsis Digital.
And, the beauty of the whole thing for advertisers, broadcasters, and the NFL is that people actually look forward to watching the ads. As in years past, you can even watch them online if you missed them, or read reports in the media about what worked and what didn't.
The next two posts are about two things: the cost of Super Bowl advertising and what this event might have to say about ways to engage people in television advertising.
Ads, eyeballs and money
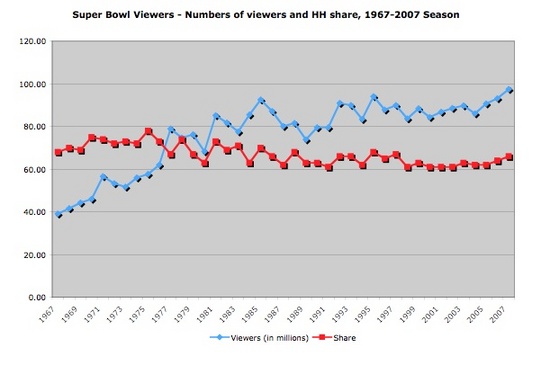
I found a very interesting chart earlier this week, compiled by Adweek with Nielsen data, on ratings and viewership of the Super Bowl since 1966, and decided to do some analysis on the cost of advertising during the and what it says about advertising and television as mass communication seems less and less relevant.
The Super Bowl is still the U.S. major TV event of the year; about 97.5 million people watched the Super Bowl on Sunday, and it was touted as the best year ever in terms of viewership. True, fewer people tuned into it than the 106 million that tuned into the series finale of M*A*S*H in the early 1980s, but better than the average episode of Heroes or Grey's Anatomy, which routinely get around 13-14 million viewers apiece.
There were quite a few reports on Fox's record price tag for advertising during the game was about $2.7 to $3.0 million per 30 second spot, an increase over last year of roughly 13% (before inflation) for just 6.5% more viewers. Still, given that television viewership has declined since the writer's strike began and the ongoing difficulty of reaching males 18-49 through television, you can see why advertisers would pay. For $27.69 and up, they can reach about a thousand viewers.
After charting and analyzing some of the data, I found a few insights I wanted to share with you in a couple of posts today, and I'd be very interested to hear readers' thoughts on these observations.
I should note that all data presented here from the 1966-2006 seasons is derived from Adweek's chart, which uses ratings data from Nielsen Media Research and ad cost data from Nielsen Monitor-Plus. Data for 2007 (i.e. this year's Super Bowl) is from Ad Age and a report in The Houston Chronicle of Nielsen data.
One key observation: Household share has been fairly flat since the late 1990s, while the actual number of viewers has increased almost every year. The correlation between the two is positive but weak (0.14). This could be a measurement issue, or it may signal that more people are watching in groups, possibly in other peoples' homes (possibly on large HDTVs?). Share hasn't exceeded 70% (of all televisions that are on during the broadcast) since 1986, and has been fairly flat at around 60%, since the late 1990s, suggesting that there may be a limit to the spread of the cultural phenomenon that is the Super Bowl to every television in America. Because the number of televisions has been increasing steadily, this would actually indicate that fewer sets are tuned into the game.
I plan to share a couple more insights in a second post later today. Unfortunately, comments are still down on the blog, but please email me at ecbaird@mit.edu.


